
![]()
Consumer and producer inflation continued to accelerate due to higher energy prices and supply concerns.

Consumer Price Index (CPI):
May (Wednesday)
Headline and core consumer inflation continued to rise last month, with headline inflation exceeding 4 percent on a year-over-year basis and reaching its highest level since April 2023.
- Prior monthly CPI/core CPI growth: +0.6%/+0.4%
- Expected monthly CPI/core CPI growth: +0.5%/+0.3%
- Actual monthly CPI/core CPI growth: +0.5%/+0.2%
- Prior year-over-year CPI/core CPI growth: +3.8%/+2.8%
- Expected year-over-year CPI/core CPI growth: +4.2%/+2.9%
- Actual year-over-year CPI/core CPI growth: +4.2%/+2.9%

Producer Price Index (PPI):
May (Thursday)
Producer inflation increased last month; headline price growth rose to 6.5 percent on a year-over-year basis, the fastest growth rate since November 2022.
- Prior monthly PPI/core PPI growth: +1.1%/+0.7%
- Expected monthly PPI/core PPI growth: +0.7%/+0.5%
- Actual monthly PPI/core PPI growth: +1.1%/+0.4%
- Prior year-over-year PPI/core PPI growth: +5.7%/+4.9%
- Expected year-over-year PPI/core PPI growth: +6.4%/+5.4%
- Actual year-over-year PPI/core PPI growth: +6.5%/+4.9%

Preliminary University of Michigan Consumer Sentiment Survey:
June (Friday)
After reaching historic lows last month, consumer confidence improved in June, due in part to falling inflation expectations.
- Expected/prior month sentiment: 46.0/44.8
- Actual sentiment: 48.9
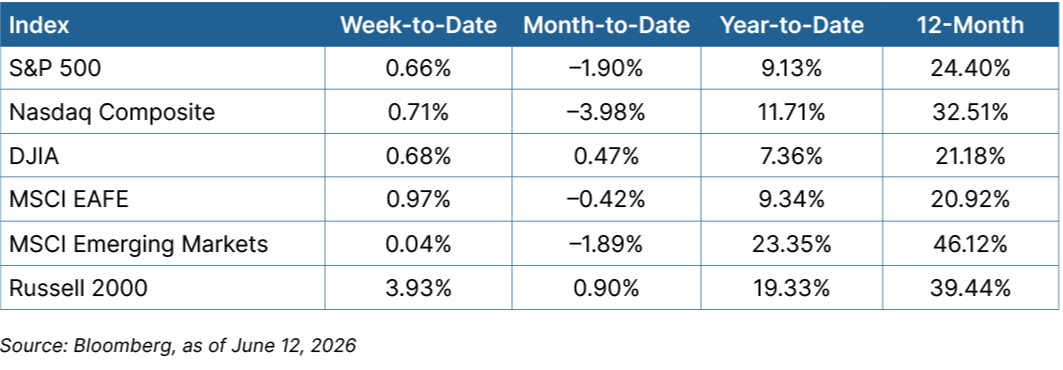
Equity
Renewed optimism about a potential settlement to the war in the Middle East and the successful SpaceX IPO buoyed investor sentiment, offsetting midweek weakness. All three major large-cap indices closed the week higher. The small-cap Russell 2000 Index rallied nearly 4 percent. Breadth was positive, with the equal-weight S&P 500 up almost 2 percent. The materials, consumer staples, and financials sectors each rose 2 percent. Communication services led decliners, falling nearly 2 percent. International markets moved higher.
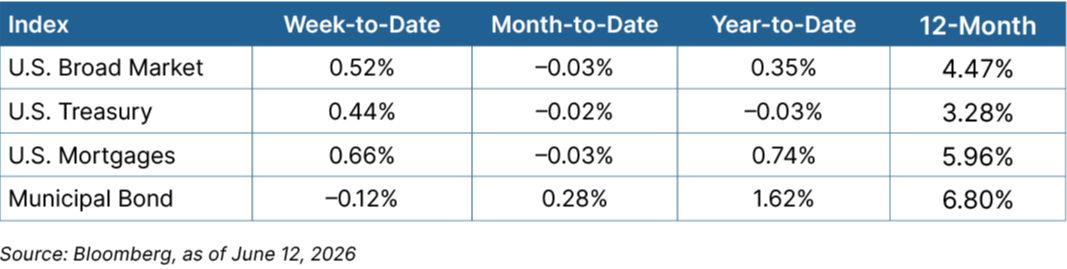
Fixed Income
The prospect of a deal in the Middle East also supported a bond market rally, pushing intermediate-term yields lower. The 10-year Treasury yield fell 4 basis points (bps) to close at 4.49 percent. Core bonds and high-yield bonds rallied, while municipal bonds declined marginally.

Looking Ahead
The first meeting of the Federal Open Market Committee (FOMC) under new Fed Chair Kevin Warsh will be this week’s focus for investors.
- The week kicks off on Wednesday with retail sales data for May. Consumers are expected to continue spending, and retail sales are expected to show another solid month of year-over-year gains.
- Also on Wednesday, we anticipate the release of the FOMC decision. Although economists and investors don’t expect a change in interest rates this month, they’ll be watching for any dissenting votes and listening to Warsh’s comments at his first post-meeting news conference.